EXAMPLE CALCULATION OF PHYLOGENIES:
THE UPGMA METHOD
![]()
Updated October 31st, 2002
EXAMPLE CALCULATION OF PHYLOGENIES:
THE UPGMA METHOD
![]()
Updated October 31st, 2002
by Dave Thomas : nmsrdaveATswcp.com (Help fight SPAM! Please replace the AT with an @ )
This page shows just one method (UPGMA clustering) for calculating phylogenies from molecular comparison data. There are many other methods (bootstrapping, jack-knifing, parsimony, maximum likelihood, and more), and these may be more appropriate to use in given circumstances. The main purpose of this page is simply to demonstrate one approach to calculation of a phylogeny from molecular comparisons.
First, let's look at some typical molecular comparison data. Figure 1 shows some typical cytochrome c comparisons (from Fitch and Margoliash, Science Vol. 155, 20 Jan. 1967). The selected comparisons have been arranged randomly (no particular order), as this makes no difference in the application of UPGMA (unweighted pair-group method using arithmetic averages) clustering. (See, for example, H. Charles Romesburg, Cluster Analysis for Researchers, Lifetime Learning Publications, Belmont CA 1984, pages 14-23.) The numbers in the cells show differences between the cytochrome c molecules of various species: for example, there is only 1 difference in the amino acid sequences between man and monkey, but there are 19 differences between man and turtle.

Figure 1. Selected Cytochrome C comparisons.
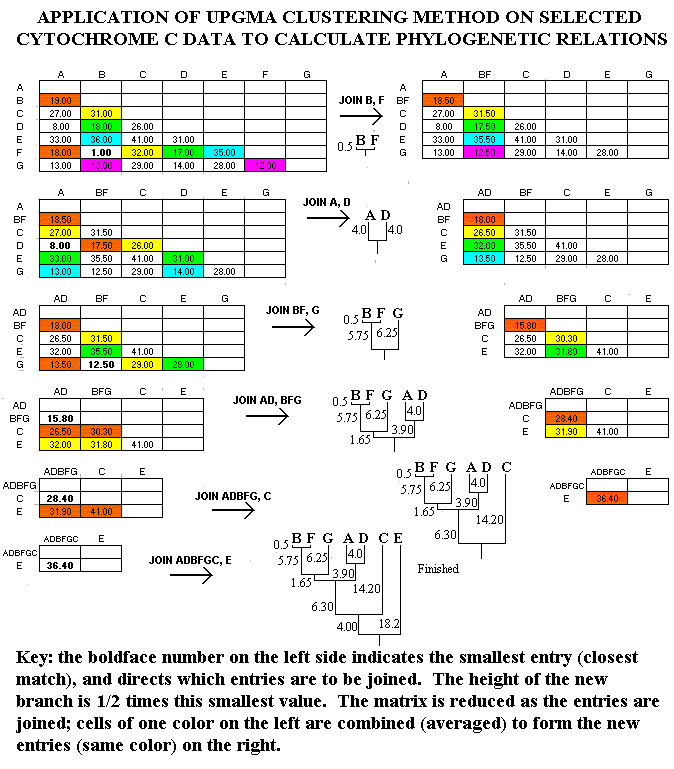
In Figure 2, the UPGMA method is applied to the Figure 1 data sample. At each cycle of the method, the smallest entry is located, and the entries intersecting at that cell are "joined." The height of the branch for this junction is one-half the value of the smallest entry. Thus, since the smallest entry at the beginning is 1 (between B=man and F=monkey), B and F are joined with branch heights of 0.5 (=1.0/2). Then, the comparison matrix is reduced by combining cells. These combinations are indicated with colors in Figure 2. For example, the comparisons of A to B (19.0) and A to F (18.0) are consolidated as 18.5 = (19.0+18.0)/2 (red cells), while the comparisons of E to B (36.0) and E to F (35.0.0) are consolidated as 35.5 = (36.0+35.0)/2 (blue cells).
The process is repeated on the reduced comparison matrix, resulting in a smaller matrix with each cycle. When the matrix is completely reduced, the calculation is finished.

Figure 2. Application of UPGMA Clustering Technique.
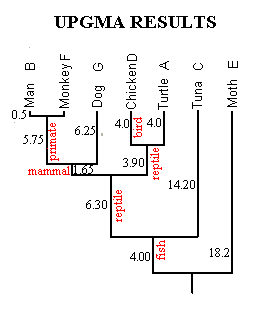
The final phylogeny calculated from the Figure 1 data is shown in Figure 3. It is in perfect accord with the fossil record, showing fish ancestral to reptiles, reptiles ancestral to mammals, birds splitting from reptiles after the reptile/mammal split, and so forth. The lengths of branches indicate time since last common ancestry; for example, moths and tuna (18.2 branch length) separated long before turtles and chickens (4.0 branch length).

Figure 3. Results of UPGMA Clustering Technique.
What makes such calculations of phylogenies interesting is the fact that the results so often agree with evolutionary trees developed from other methods (anatomy, fossils, or other proteins or genes). Indeed, molecular comparisons provide ample "repeat experiments" of the hypothesis of evolution.
COMPANION ARTICLE:
David Thomas, "Charles Darwin et. al. on Hierarchies and
Phylogenies," October 2002A,
http://www.nmsr.org/darwin.htm
![]()